

What this solves
You want to see whether the VPS is CPU-, RAM-, or disk-bound before optimizing or upgrading.
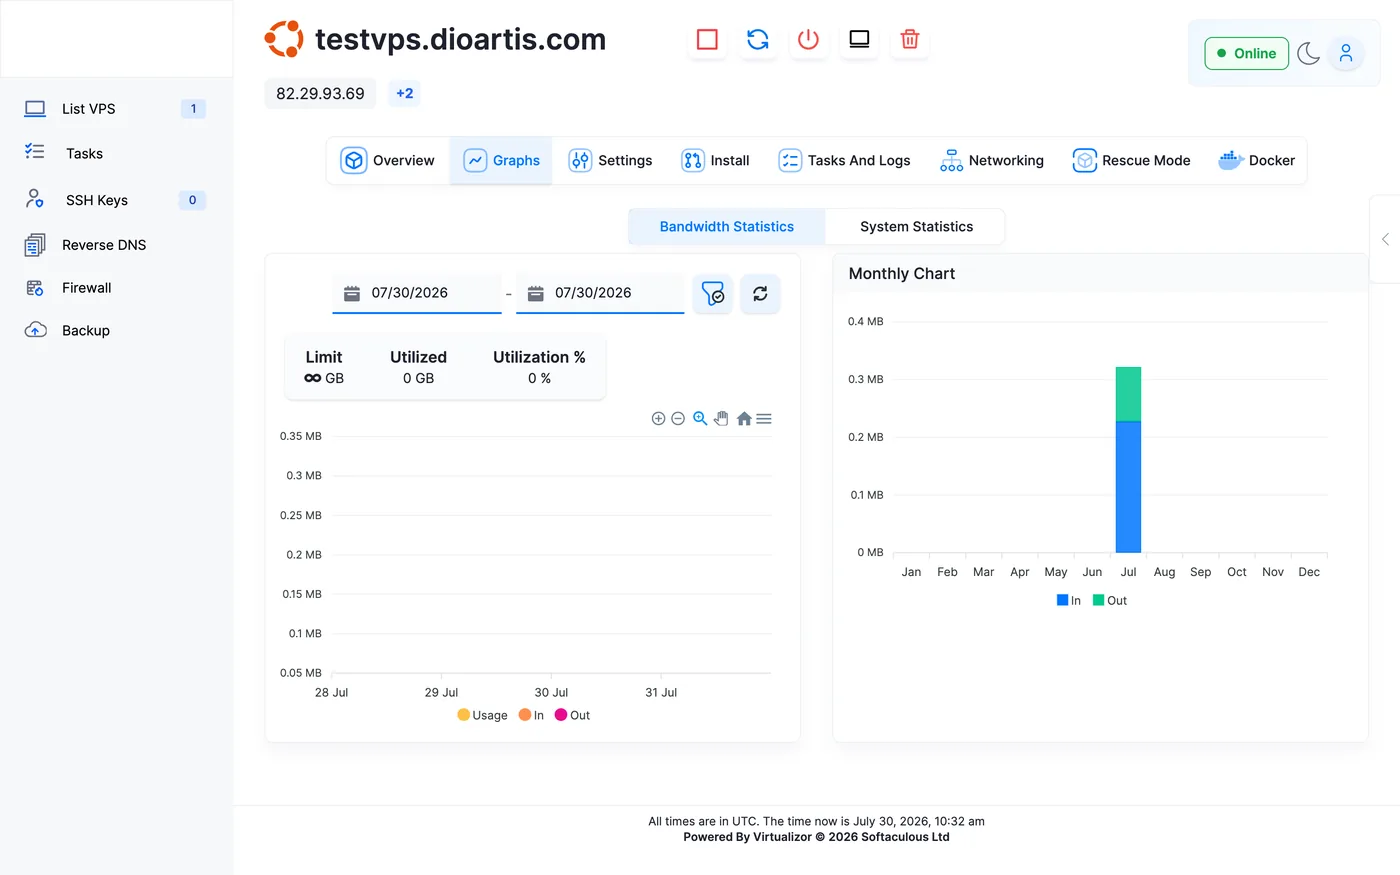
Enduser Panel graphs
Client Area → your VPS → Enduser Panel. The Overview shows Disk Usage, Bandwidth, and CPU. Open the Graphs tab for detailed charts over time.
Quick SSH commands
top or htop — live CPU/RAM per processfree -h — memory summarydf -h — disk spaceuptime — load averagesiotop (if installed) — disk I/O hotspots
How to read the numbers
- CPU — sustained load near or above your vCPU count means the guest is busy; short spikes are normal
- RAM — low “available” with heavy swap use is a problem; Linux using RAM for cache is usually fine
- Disk — stay under ~85–90% used so logs and updates don’t fill the volume
When to upgrade
If CPU load stays high, RAM stays under pressure, or disk is nearly full after you optimize the app, request a VPS upgrade (ticket/Sales — no self-serve Upgrade/Downgrade on VPS).
Tip: Compare Graphs with SSH so you know whether the bottleneck is the guest OS or what the hypervisor reports.
When to contact support
If graphs look wrong versus SSH, open a ticket with screenshots from both views and the approximate time.
Was this helpful?
Thanks for your feedback!